Dana Gas – ADX
- April 13, 2022
- Stock Stalker
- 1

Lets Talk Technical
Overall Dana is in a strong uptrend its above 200 day moving average giving us added confirmation that we are in a established up trend.
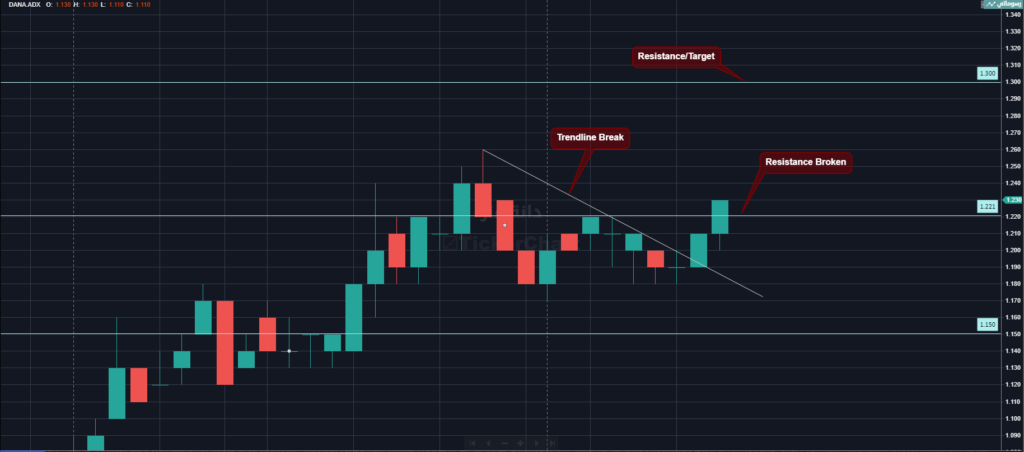
Recent rally in Dana is seen from 1.02 level and with todays closing 13/04/2022 at 1.23 I think its now ready to fly higher. As I just mentioned its in a strong up trend for now so we can expect that it will break the resistance of 1.30. Today we didnt see big volumes coming in but the neck line of this W pattern or double bottom is broken which was a small resistance. After hitting the resistance at 1.25 it came down and found support at 1.18 that was previously a resistance. We are seeing market have restest this zone 2 times successfully to close above the neck line – 1.22
Bullish Chart Pattern
As market participants buy and sell they leave their “traces” behind which show us the psychology of the market. Such patterns when identified gives edge to a technical trader to plan the trades. There are many bullish chart patterns one of them is double bottom or W pattern that is one of my personal favorite and which has 80% accuracy approx. If tomorrow it opens with a big gap up wait for a correction any gap down opening will give us a indication that there is weakness in the market so wait for the price action and then take a entry. My first target will be 1.30 and then 1.40 with my stop loss at very safe place at 1.17.
Double Bottom chart pattern is very effective if formed at a importnat support level. Usually this chart pattern indicates a reversal after a down trend but it also works in a trending market.
If you would like to learn stock trading and want to start a passive in come in UAE click here.
Do not forget to subscribe by Youtube channel – click here.
This article is for educational purpose please do your own research before investing.
All The Best!!


good